BI and Reporting for NAV
Data contained within the ERP can be managed by various BI solutions, depending on your expectations
Business Intelligence
–
A challenge for your company
Producing Business Intelligence can become a real challenge for SMBs which don’t have IT specialists, even less BI or Reporting specialists.
In the same idea these SMBs don’t have the IT environment able to host a datawarehouse and to extract, transform or load hetergeneous data within a structured database.
Hopefully, BI oriented IT costs have dramatically decreased these last years, but the choice of the right Finance solution remain key for companies.
This Finance solution has to be able to interact with existing solutions, including databases and BI/Reporting tools.
–
–
Power BI analysis
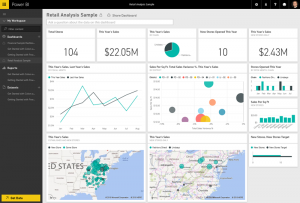
 Power BI is a BI or business analysis tools set using the natural language as its queries creation mode, and able to transform your company’s data into visual clear and understandable graphs.
–
Power BI allows to create or modify several reports or charts that can build one or many dynamic dashboards. This tailor made dashboards allow users to access at the same place and time, to real time relevant and key information, from any device (PC, Tablets and Smartphones). User can then point out trends potentially impacting company’s decisions.
These KPI (Key Performance Indicators) will make use of ERP data easier and add to it information coming from various sources, including Internet (e.g. Geographical maps).
–
These reports can then be safely published within the Company, and updated automatically in order to provide an access to up-to-date information.
–
–
Analysis within NAV
 Companies using ERP catch a huge quantity of data through their own business solutions. This data composed of various information, such as sales, purchases, facilities, wages, budgets…, can become valuable data for decision makers, as far as they can use them to create relevant charts.
When analyzing financial data, a dimension is a value to be used as a mark when added to an entry. NAV can then use this data to group entries having the same dimensions, such as customers, regions, items or sales representative, and therefore use these groups within analyses. Dimensions can be used on journals entries, on documents or on budgets. Dimension describes how the analysis is performed.
A 2 dimensions anlaysis, for example, can be sales per region. However by using more than 2 dimensions during entries or documents registering, user can conduct more complex analysis, such as sales per marketing campaign per customers groupe, per area… Data analysis per dimension will hep you to acquire a better knowledge of your company insights, knowing where it earns money, and where is doesn’t, where company needs to involve more resources, or decide to define the right actions on each area.
NAV allows you to organise and analyse your data per dimensions.
–
–
–
Mode information within the Microsoft brochure about Business Intelligence (BI) for NAV (In English) :
High availability SLA (99,9%)
A simple and user friendly admin interface
A real time setup of servers (VM Azure…)
Multiples VM monitoring tools
Invoicing on use and ability to switch off VMs
A Cloud service with high level commitments and certifications
TEMOIGNAGES CLIENTS
Nos clients sont meilleurs ambassadeurs :
